Categories
Meta Tableau

Top 5 New Features in Tableau Desktop 2022.2

Woah, big Tableau release in mid-2022! I’m going to do a video walk-through for 2022.2 and a brief text summary below.

Walk-through video

Top 5 New Features in Tableau Desktop

1. Add Filters Object

User – “Hey could you just add this filter please”

You – “Sure, done!”

User – “Could you add another one actually”

You before 2022.2 release – “GRRRRRRRRR”

You after 2022.2 release – “I added in a button that lets you pick which filters you want from the entire data set!”

This feature is Tableau’s further move to empower users and reduce developer headache. It’s analytics on demand baby!

2. OneDrive and SharePoint Online Connector

For everyone in Big Corp®, this is a huge deal. With all the files floating around various shared OneDrive folders and SharePoint sites, you now can directly connect to these in Tableau without any extra licenses or headache.

3. Workbook Optimizer Improvements

This feature was a game changer when it was released. And it’s only getting better.

Tableau doesn’t list what was added. But they do have all of the Optimizer guidelines documented here: https://help.tableau.com/current/pro/desktop/en-us/wbo_overview.htm

4. Data Stories

It’s possible that we look back at this list in two years and we think Data Stories should have been the number one new feature. For right now, it feels like it could be big for data literacy purposes, but might be too much too soon.

5. In-product Exchange

Let’s be honest… it’s hard to keep up with all the Tableau releases and features. While Tableau Exchange was a great addition, how may people are going to separately seek it out when developing in Desktop?

Tableau read the minds of users (probably through product usage data), and now made Tableau Exchange in-product. No need to leave Tableau Desktop for access to Tableau Accelerators and Extensions.


Thanks for reading this far. Are you banging your head against a wall trying to build analytics solutions for your business? Never catching up on the backlog of projects that needed to be done yesterday? Are you struggling to assemble a full-stack data team with the resources you have available?

I run MergeYourData.com, where we provide you with a team of vetted data experts for the price of one full-time employee. Leverage our team of experts to get impactful data analytics for your business, without the headache of hiring, training, and managing a whole team yourself.

We like to say it’s like paying for a Swiss-army knife, but getting access to a shed full of tools instead. If any of what I’ve described sounds like where you’re at, book a call below.

https://www.mergeyourdata.com/schedule-a-meeting

Processing…
Success! You're on the list.
Categories
Tableau Tips

Quick Tip: Create calculated fields from table calculations with drag and drop

It’s Quick Tip time for Tableau Desktop!

This one is great for advanced developers and beginners alike. It’s a fast way to create a table calculation Calculated Field without having to actually think about it.

For beginners that’s great because you can see how these calculations are built so you can learn how to build your own custom ones.

For advanced developers, it’s a huge time saver when re-using table calcs in your worksheets. 2 minute video provided below.

Quick Tip: Drag and drop your Table Calc on your worksheet canvas to the fields in your data pane

A short YouTube video I made

I forgot about this one until I was reading up on the new Data Stories feature in Tableau’s documentation: https://help.tableau.com/current/pro/desktop/en-us/data_stories_table_calculation.htm

A Final Note

There are only more and more features coming out for Tableau Desktop, Online, Prep, etc. It’s becoming a more difficult discipline to be an expert in. Just keep working!

One last note… I run a company called MergeYourData.com. We provide fully capable data teams to companies for the price of one full-time employee. If you’d like to come build Tableau solutions for us or contact us about a project you had in mind, please visit www.mergeyourdata.com

Processing…
Success! You're on the list.
Categories
Meta Tableau

Top 3 New Features in Tableau Desktop 2022.1

New year, new Tableau release! I’m going to do a video walk-through for 2022.1 and a brief text summary below.

Walk-through video

Top 3 New Features in Tableau Desktop

1. Workbook Optimizer

Wondering why your workbooks aren’t performing as expected? Before this you would have to open up a PDF or web page with suggestions for designing more efficient workbooks. Then you guess at what you could do better.

For the really hardcore performance tuning, you might have even done performance recording to see what exactly is going on with hard data.

But gone are those days! Now Tableau will give you a quick breakdown of things you did well and things you can get better on.

P.S. If you’re doing performance recording, there can be significant differences between performance you see on Desktop and that same workbook’s performance when you publish to Server. If you’re experiencing this, reach out to me here.

2. Customize View Data

The old View Data window was stuck in the Windows 95 era. In 2022.1 you have much more control over that window and improved look and feel.

3. Swap with Root Table

If you’ve ever used complex data source models in Tableau with multiple relationships, you’ll know exactly why this is a big deal.

Instead of having to erase everything and start from scratch when you want to switch table position in your model, you now have the menu option to have Tableau swap that table position with root (or other tables).


Thanks for reading this far. Are you banging your head against a wall trying to build analytics solutions for your business? Are you struggling to assemble a full-stack data team with the resources you have available?

I run MergeYourData.com, where we provide you with Analytics as a Service. Leverage our team of experts to get impactful data analytics for your business, without the headache of hiring, training, and managing 3-5 people.

If your business makes between $10-50 million per year in revenue, you probably realize how critical data is to continuing your growth. Our services let you achieve that without all the associated overhead.

If any of what I’ve described sounds like where you’re at, book a call below.

https://www.mergeyourdata.com/schedule-a-meeting


Wrapping Up

Thanks for reading. Hopefully this post and video helped you understand the newer features in Tableau 2021.4. Feedback or questions? Post a comment or send me an email!

Processing…
Success! You're on the list.
Categories
Tableau Tips

Quick Tip: Refit Clusters after refreshing extracts on Tableau Desktop

It’s Quick Tip time for Tableau Desktop!

After working with Tableau’s clustering capabilities for a while, I came across a situation where all my saved clusters disappeared after refreshing extracts.

Well… the saved cluster didn’t disappear, it just all turned the same color and didn’t cluster.

Unfortunately I haven’t remembered every page of Tableau documentation yet so I got tripped up. But the fix was simple, and here it is.

Quick Tip: Right-click your saved cluster and select Refit.

A short YouTube video I made

This is truly a quick tip, but might relieve some panic when your data refreshes and all your beautiful clusters get washed out.

A Final Note

If you haven’t jumped into Tableau clustering before, there are some really good blogs and documentation around it. Here are a few links:

Thanks for reading!

Processing…
Success! You're on the list.
Categories
Meta Tableau

Tableau 2021.4 top new features

Like the last time I walked through the top new features (for 2021.2), I’m going to do a video walk-through for 2021.4 and a brief text summary below.

Walk-through video

Summary of top features

Tableau Desktop and Web Editing

1. Copy and Paste in Dashboards

If you’ve been using Tableau, you’ve always scratched your head as to why this isn’t a feature. Copy and paste on Dashboards is now possible. It is only with objects that don’t contain any worksheets in them. But still, this is a huge productivity gain.

2. Edit Published Data Sources

In my opinion, one of the biggest discouragements from publishing a data source with standardized calculated fields was the difficulty in editing that data source. Well, now you can directly edit published data sources without downloading it and then republishing.

3. Tableau Exchange – Tableau Accelerators

Tableau… I mean Salesforce.. has bigger goals for Tableau. It’s clear they want to grow the marketplace of resources to make development and adoption easier.

Enter Tableau Exchange. Specifically Tableau Accelerators. These “Accelerators” are to give you basic templates to kick-start your development so you don’t have to start from zero.

It’s not a silver bullet since you still have to customize it to your data, but it’s a step in the right direction.

4. Multiple data sources in map layers

Break free from a few of the data prep complexities when building map visualizations! Now you can use multiple data source as map layers in a single worksheet.

5. New Metrics Improvements

  • You can now embed Metrics into apps, corporate portals, and webpages
  • You can now set things like the comparison period, date range, and color status indicators for each Metric

Tableau Online/Server (Specifically for Data Management Add-On)

1. Virtual Connections

In both Server and Online, you can now create and share access to tables, embed service account credentials, define data policies, and extract data centrally.

Bolded items are ones that really get me charged up.

2. Inherited Lineage Descriptions

This one feels like a further play to compete with 3rd party tools for data management. Now, everywhere a data source or workbook is used, the description will be consistent.

Tableau Prep

1. Parameters in Flows

This one is like a small seed that has the potential to sprout into a fruit-bearing, full-grown avocado tree.

You can now add some rudimentary parameters in Flows. This means you can run flows for specific inputs that are chosen at run-time.

If you’re familiar with Alteryx, this is a feature they have for both local and Alteryx Server apps. It allows users to run customized reports based on choices or data they enter before the flow is run.

While Tableau has a very basic implementation of parameters, I expect the functionality to converge with parameter features that exist in Desktop. So things like setting parameter options to the unique values of a field (like the data set’s date range).


Thanks for reading this far. I run MergeYourData.com, a consultancy that empowers businesses with automation and data.

If you’re frustrated or overwhelmed with your daily processes and feel like you’re not getting the most out of your analytics investment, reach out to us.

https://www.mergeyourdata.com/schedule-a-meeting


Wrapping Up

Thanks for reading. Hopefully this post and video helped you understand the newer features in Tableau 2021.4. Feedback or questions? Post a comment or send me an email!

Processing…
Success! You're on the list.
Categories
Dashboards Tableau

Bad bookmark behavior – an inside look at a personal habit

Click here to jump straight to the dashboard

Some people are normal when it comes to saving things they care about. Some people have problems physically hoarding objects that link them to past memories. But me… I have problems with digital hoarding. It’s probably related to some combination of FOMO and consumerism that drives me to hitting that save button. Because… you know… I’ll eventually get back around to it.

So naturally, instead of actually revisiting some of my past bookmarks, I built a dashboard to analyze my bad habit.

I use a bookmark tool called Raindrop.io, which has an API I can easily pulled structured data from. Using this API, I extracted the bookmark data to a spreadsheet with a low-code automation tool called Integromat. It took about 2 minutes to do and I can run the automation again in the future or schedule it to run if I want to update my data.

Integromat is something I use frequently in my consulting business (MergeYourData.com) to automate business processes. It’s a great tool you should check out if you have automation needs but don’t want to code custom solutions.

So what did I build?

This was a fun and simple visualization. I just wanted to look at how frequently I was bookmarking things over the past year or so with Raindrop.io. So I did breakdowns by month, day, weekday, and hour.

Aliens and UFOs seem to be a hot topic ever since the Pentagon declassified some Navy videos in 2020. So why not make a viz with that theme?

The Dashboard

Thanks for reading. Any questions or comments? Feel free to reach out to me via email on my contact page.

Categories
Meta Tableau

Game-changing features in Tableau Online 2021.2

I’m going to try a little different format for this post. Instead of mostly text, I did a walk-through video of the new features. There’s still a summary of the best new Tableau Online features in 2021.2 below, and some additional information I didn’t cover in the video.

Walk-through video

Summary of top features

1. Ask Data

There is a powerful new concept called a Lens for Ask Data now. It’s a configurable “view” of Ask Data that limits fields and permissions for the Ask Data Lens. You can also embed an Ask Data Lens into your dashboards now.

Last cool thing with Ask Data is that Viewers can now use it. That’s a big bonus.

Check out more info on Lenses here: https://help.tableau.com/current/online/en-us/ask_data_lenses.htm

2. Explain Data

Explain Data is now available for Viewers (just like Ask Data). Don’t forget that Explain Data has to be enabled for each dashboard you publish so that Tableau Online users can utilize it.

3. Collections

Content navigation is always a challenge. There’s new content every day inside and outside of your company. It’s no different with Tableau content. Tableau has slowly added content curation abilities over the years. Now it’s gone full curation mode.

Collections allow you to add Tableau objects (workbooks, data sources, lenses, etc.) all in one place and control the audience. That means you can make private or public collections that hold content across any project on your site.

Before you were limited to favorites, projects, etc. This is a big step forward for personalized and targeted content.

4. Immediate transition button from Web Edit to Tableau Desktop

Ever want to make a quick fix in web authoring, only to realize that you need some of the additional features Tableau Desktop has in order to get it done? Well now, it’s as easy as a click of a button to open that workbook in Tableau Desktop.

No more downloading, going to your downloads folder, then opening the workbook.

Wrapping Up

Thanks for reading. Hopefully this post and video helped you understand the newer features in Tableau Online 2021.2. Feedback or questions? Post a comment or send me an email!

Processing…
Success! You're on the list.
Categories
Tableau Tips

Quick Tip: How to develop more efficiently with big data sets Tableau Desktop

It’s Quick Tip time for Tableau Desktop!

Do you work with large non-local data sets? For example, something like a live connection to Snowflake or SAP HANA?

If so, you’ve come across frequent loading screens when you switch dashboards or worksheets. This is when Tableau is querying the data source again to grab the most up-to-date data.

Think about how much time this wastes while developing dashboards! Especially if you have a dashboard that has a decent number of worksheets. Then we’re talking about several seconds of querying and loading.

Even if you haven’t run across this yet, read this quote straight from the horse’s mouth (Tableau):

If you’re working with a complex view or a very large data source, refreshing data can take a long time.

Tableau’s Refresh Documentation

and

When you create a complex data view that involves many fields, these queries can be time-consuming. 

Tableau’s Performance Tips

Here’s a quick tip on how to avoid this and develop in Tableau more efficiently.

Quick Tip: Pause Auto-Updates for your data source

It’s as easy as clicking a button.

The setting allows you to pause updates on the dashboard, on the worksheet, and on the filters. So you can control which components are kept up-to-date. And if you want to force an update, you can always do that without turning back on auto-updates.

This is also applicable for users exploring dashboards. Tableau Online and Tableau Server will allow a person viewing the workbook and/or a person editing the workbook in the browser to pause the data source for increased performance.

Make sure to read the documentation to see how Tableau handles this setting while publishing workbooks.

https://help.tableau.com/current/pro/desktop/en-us/queries_autoupdates.htm

A Final Note

You’re going to forget that you’ve done these things to make development more efficient. When you inevitably ask yourself:

Why isn’t anything updating!!!! 😡😤🤬

– Me once per month wondering why I’m not seeing updates

So don’t forget to toggle the auto-update settings back or to switch your data source back to live.

Also, I embedded this video in my last post and want to share it again so here ya go:

Pssst, I’m letting you know you’re in the good ole days of Tableau right now. Enjoy it!

Thanks for reading!

Processing…
Success! You're on the list.
Categories
How-To Tableau Tips

Quick Tip: The MAKEDATE Function in Tableau Desktop

It’s time for another Quick Tip in Tableau Desktop!

Have you ever had a pesky data set in Tableau that has Year, Quarter, Month, Day, Minutes as separate fields? This structure can be useful for certain analyses, but a pain-in-the-butt for other analyses that just need a single regular date field.

Have no fear! There is a simple fix for this.

It’s called the MAKEDATE function and it helps you make a date out of the fields you have.

Here’s a quick, soundless video that shows the function:

It’s as simple as this: MAKEDATE(year, month, day). That’s it. Now you have a continuous date field that behaves how you would want your date data to behave.

A Final Note

Tableau can actually “MAKE” a bunch of useful calculated fields that enable tons of analyses. I like to call these the MAKE-it-happen family… mostly because I can’t think of a better name (suggestions are very welcome). They include:

  • MAKEDATE
  • MAKEDATETIME
  • MAKELINE
  • MAKEPOINT
  • MAKETIME

They’re transformative both literally and figuratively by enabling developers to convert data directly in Tableau. Things like MAKEPOINT and MAKELINE had to be done outside of Tableau back in the “good ole days”. But fortunately, it turns out that we’re in the good ole days right now and they keep getting better! Queue a great The Office quote…

Pssst, I’m letting you know you’re in the good ole days of Tableau right now. Enjoy it!

Thanks for reading!

Processing…
Success! You're on the list.
Categories
How-To Tableau Tips

Quick Tip: Hide the Null indicator in Tableau Desktop when you don’t want to filter the data

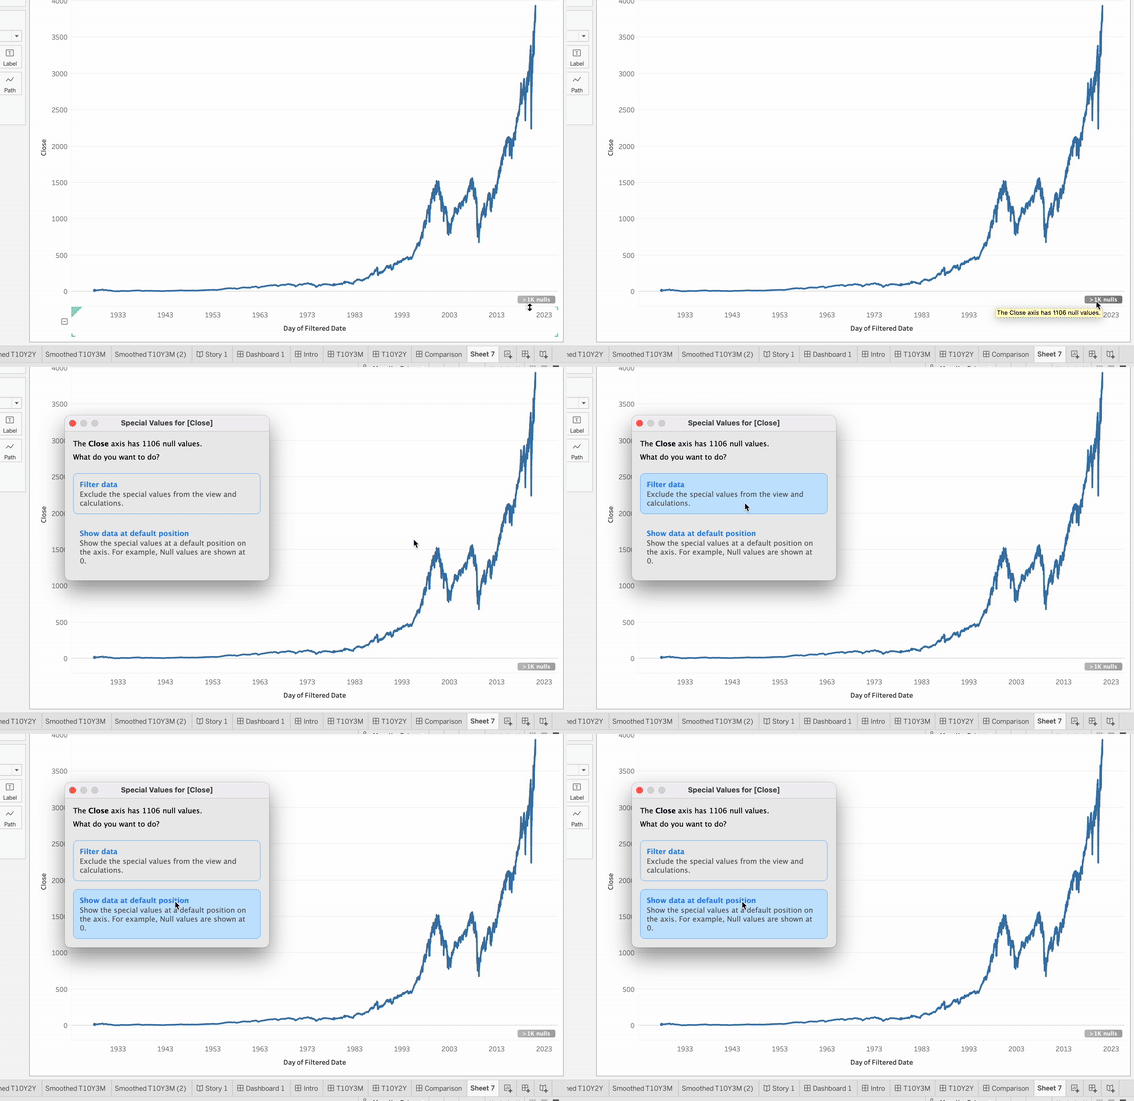
Sometimes Tableau’s UI can be misleading. If you’ve had the NULL values indicator pop up in the bottom-right corner of one of your worksheets, then this is one of those misleading times.

A simple click on the indicator would suggest there are two options to handle NULLs. The first would be to filter the data. The second option is to show data at the default position.

Clicking on the Null indicator will pop up this option box

This window is standard for non-geographic worksheets. Geographic worksheets will instead show this window:

https://help.tableau.com/current/pro/desktop/en-us/datafields_specialvalues.htm

But there are actually other options available outside of these!

The Quick Tip

Let’s say you want to leave everything as-is, but don’t want to have that ugly NULL bubble in the bottom right corner of your worksheet view. The way you can do that is LITERALLY THE EASIEST THING EVER. Yet I didn’t learn this until a couple years until my Tableau journey. Ok, now don’t be mad when I tell you this…

Right click the indicator and select Hide.

Yup. That’s it. Here’s a gif of me doing it:

Seriously, it’s that easy.

Be aware that Tableau will choose the specific behavior of hiding the indicator. This means that for something like line charts, it could hide the indicator and keep the line connected. But if you wanted to control that behavior and break the line instead while hiding the indicator, you can use the method described below.

Another NULL Formatting Tip

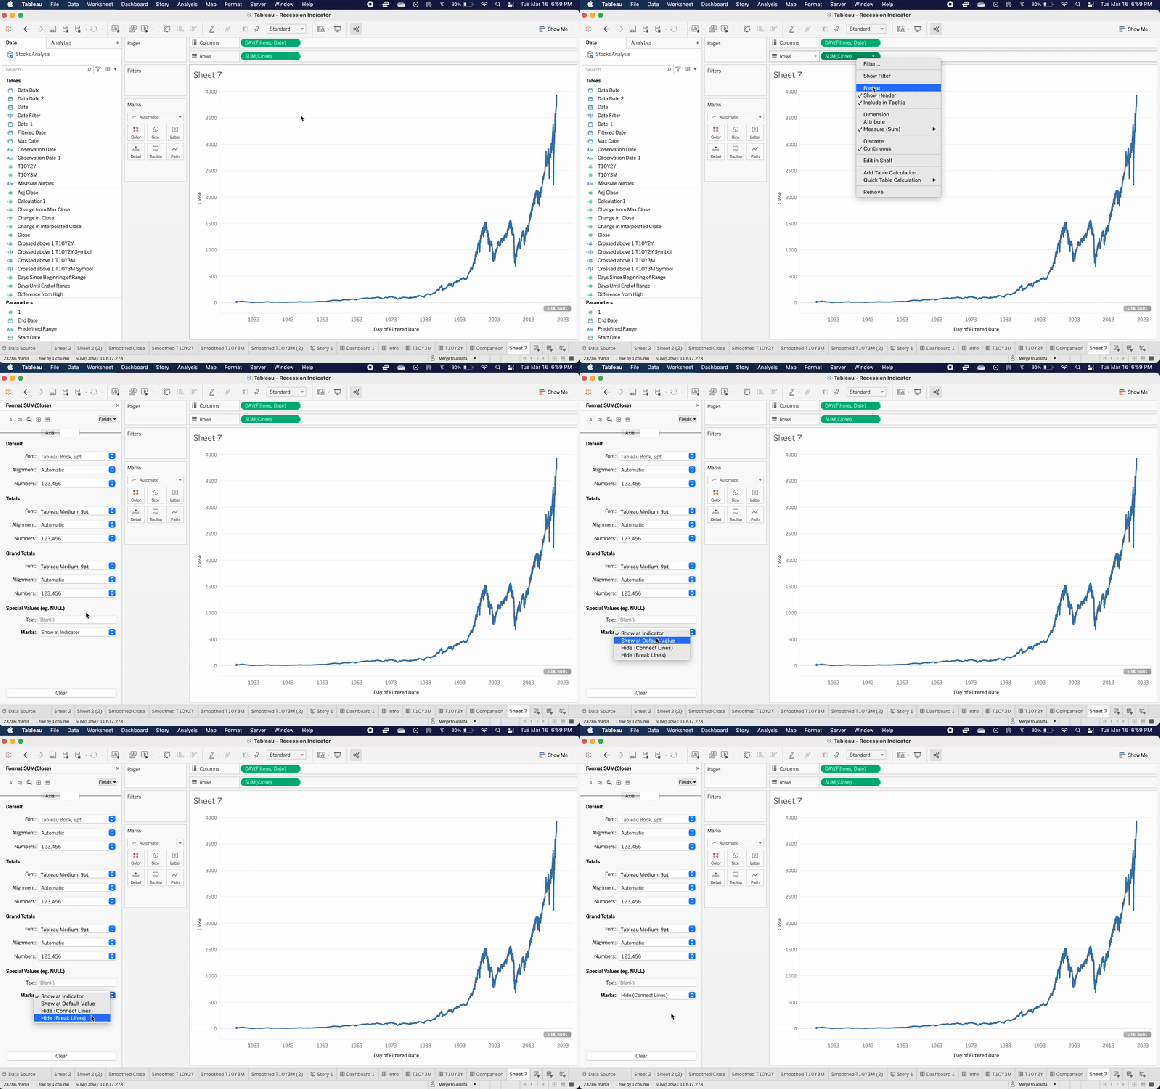
There’s an additional method to handling NULL values in Tableau. This involves changing the formatting of the specific field.

  1. Right click any field, and select Format.
  2. Click on the Pane tab of the Format window.
  3. At the very bottom you’ll have a Special Values section for Text and Marks. Here you can enter an alias for the text values or select from one of four dropdown options for the Marks.
Right-click on any field you want to modify Special Values for.

That’s it. Hope this tip helps! Please send me an email (dan@mywebsiteURL) if this post helps or if there are other topics you’d like covered!